INFUSE

Key Topics

INFUSE overarching goal is achieving an optimal energy transfer in emerging, inertialess grids, with high share of RESbased energy sources. Planned for 24 months with a small consortium (5 partners and one observer, from three EU countries), the project addresses multiple topics.

Romania - Politehnica Bucharest - Student Campus and GreenMogo

High-reporting rate information for loading. The information for the load side is derived from local measurements using the concept of the Unbundled Smart Meter (USM) set on 1 frame/second reporting rate [8], [9]. This is achieved using Raspberry Pi boards (RPIs) connected to different types of smart meters

High-time resolution measurement information (1s resolution) for PV generation and Battery Energy Storage Sytem (BESS) is achieved by connecting a RPI via TCP/IP protocol to the inverter and performing dedicated software configuration based on Python. On the RPI, the script is running to collect the data locally in .csv files and forward the readings to the platform.

Ambiental monitoring is performed using weather stations and other environmental sensors (e.g., temperature, humidity, air pressure, wind speed) that communicate especially via the LoRaWAN protocol. Smart agents are deployed at the application layer and handle the translation of the sensor data into NGSI-like-compliant entities that are then sent to the platform,

The prosumer platform integrates data from smart meters, PV inverters, BESS units, weather stations, and other sources using an updated FIWARE NGSI format to ensure interoperability. Its architecture includes a Data Harvesting Layer for unified collection, a Temporary Logic Layer with Smart Converters (APIs) that translate heterogeneous inputs into NGSI-like entities, and a Persistent Logic Layer based on a context broker for processing and integration. Data is stored long-term in technologies such as MongoDB, InfluxDB, or CrateDB, while the Presentation Layer enables visualization and third-party services through tools like Grafana, Chronograf, or custom apps. This updated platform extends earlier work by integrating load, generation, and ambient sensor data to demonstrate the feasibility of multi-source measurement integration and interoperability with third-party applications. Cybersecurity performance depends on the local network and a dedicated VPN connecting prosumer-side entities with the central server.

A general single format for integrating multi-vector information is based on open-source algorithms that normalize data from diverse sources, flexibly adapting different reporting rates within a cross-platform, multi-vector software environment. The format used to transfer data from the process level to the ICT platform is shown below, together with the interface for developing smart extensions that convert equipment-specific data into the unified format.

Within the framework presented in this paper, an important aspect is given by the IoT Agents (smart converters or APIs that act as a bridge between diverse devices and the Context Broker, enabling devices to communicate using their native protocols while ensuring data is translated into the NGSI format used by the platform. This simplifies device integration by supporting a wide range of protocols (e.g., MQTT, HTTP, CoAP) and converting incoming data into standard NGSI entities. In other words, those agents function as smart converters, transforming data from heterogeneous sources into the unified NGSI format used by the platform. These agents enable seamless integration of diverse systems and protocols — such as smart meters, energy management systems, PV systems, wheatear data, or industrial sensors — by translating device-specific data models into standardized NGSI entities.

The optimal operation of a microgrid with operational constraints (no energy exchange with the public grid) was demonstrated using numerical models in a real-time digital simulation environment, relying on real measurement data and respecting imposed power profiles. A control strategy for microgrids and a digital-twin framework were developed through Software-in-the-Loop (SIL) and Power-Hardware-in-the-Loop (PHIL) experiments.

Real data (PV power profiles, load profiles, and DSO-defined profiles) with a 1-second time resolution were integrated, and the Energy Management System, implemented in MATLAB, was validated in real time through interactions between the simulator and physical equipment (e.g., PV inverter). This setup enabled testing of control strategies and setpoint modulation, supporting the development of solutions for microgrids and energy communities.

Romania - ICPE-CA - Renewables Laboratory

The main parameters monitored within the INFUSE project were selected to enable the evaluation of electrical performance, the characterization of environmental conditions, and the determination of health indicators for the photovoltaic system. This approach aims to optimize operational management and facilitate early fault detection through a distributed monitoring solution based on an edge-computing architecture. Depending on the electrical and environmental parameters considered relevant, a preliminary sensor selection phase was carried out, with the objective of identifying devices that meet the technical and functional requirements for integration with the open-source InfluxDB platform, as well as ensuring their compatibility with the real-time digital simulation environment used in the digital twin.
A real-time monitoring system for single-phase photovoltaic installations was developed using an Arduino Opta micro-PLC equipped with a dual-core STM32H747XI processor and hardware cryptographic security. The monitored PV system (3.84 kWp) includes two strings of eight Panasonic modules connected to separate MPPT inputs of a 4 kW SMA inverter. The experimental setup enables real-time acquisition of DC and AC electrical parameters at one-second intervals and allows visualizing the recorded data for up to three months.
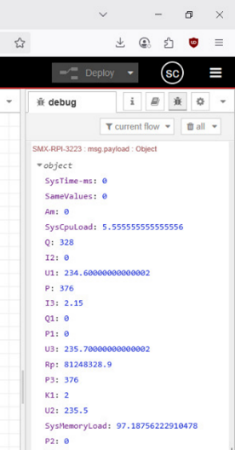
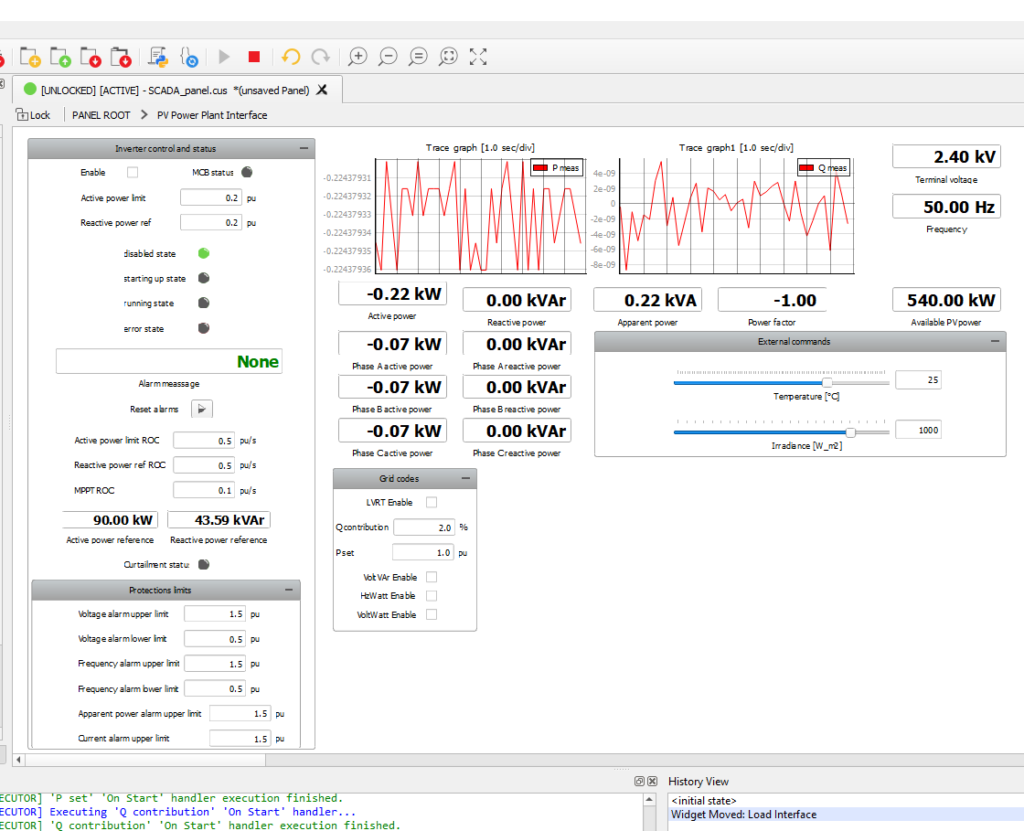
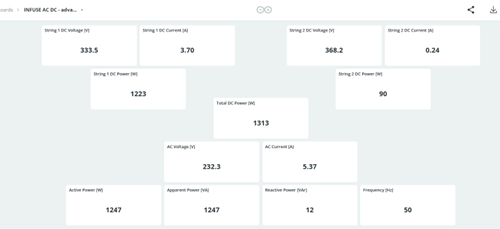
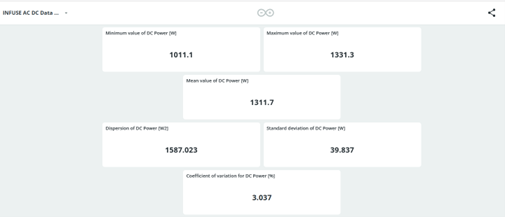
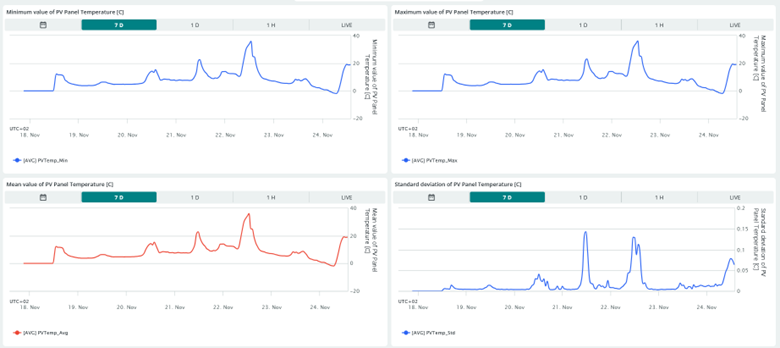
A graphical interface was developed to display real-time monitoring of DC and AC parameters. Key statistical indicators—minimum, maximum, mean values, dispersion, standard deviation, and coefficient of variation—were computed every minute using data sampled at one-second intervals. The analysis covered all major PV system parameters, including DC voltage and current for both strings, total DC power, AC voltage and current, active, apparent and reactive power, and frequency.

The CR1000X data logger used for monitoring meteorological parameters was connected to the local Ethernet network. Processed statistical data is stored in its flash memory as IEEE4 Data Tables, with 72 MB available—enough for about 20 months of recordings. To aggregate data with other sources, the built-in HTML server and API interface allow querying the latest stored values. For long-term storage, new data is exported once per day to a local FTP server in TOA5 text format, including headers and index numbers to ensure data longevity.

The measured data show the variation of direct and global solar radiation, as well as PV module temperature and ambient air temperature, recorded using the monitoring system developed in Stage 1.

Implement a hybrid state estimator for distribution network operators

Develop a data integration module capable of seamlessly integrating PMU data with very high-reporting rates (50 frames /s) in the same open-source platform using the common format. Ensure the synchronization and real-time availability of PMU data for grid monitoring and control purposes by implementing a hybrid state estimation system that combines PMU data and smart meter data (mixed reporting rates).

Integration of real-time digital simulation tools and live demonstration in campus grid

Establish an integration mechanism of heterogeneous data with real-time (heterogenous) digital simulation tools for modelling and simulation of energy transfer in emerging power grids.

Develop multi-vector, heterogeneous sources data integration framework

Create a robust data integration and exchange framework within a software cross-platform using a standard format capable of handling multi-vector measurement information, including power profiles with a high-reporting rate (1 frame/s) and environmental conditions data from sensors with a time resolution of 1s or lower.

Enhancing grid intelligence

Enhancing grid intelligence as a way to successfully transform the operation of emerging power systems by including local information processing (edge-computing) in the context of distributed generation and high-penetration of RES.

Optimization of the MV distribution grid

Optimization of the MV distribution grid operation by design and validation of a software tool able to process data streams from synchronized measurements (PMUs) with further input to hybrid state estimators

Implement correlation and data analytics computing

Develop an intelligent data analytics engine that can process and correlate information from various sources (energy transfer parameters, environmental and contextual conditions). Develop and adapt data analytics algorithms to extract meaningful insights from the integrated information, enabling real-time anomaly detection, predictive maintenance, and energy control.
Scroll to Top